App Walkthrough
Contents
App Walkthrough#
This page provides a walkthrough of the NEMGLO App, based on version 0.2 Beta. You will notice there are many overlaps in features and terminology used as in the python documentation. Alas we have simply provided a user interface overlay to all the magic that happens behind the scenes!
If you haven’t already installed NEMGLO App, navigate to the Get Started Webpage. If you have, let’s begin…
Welcome to the NEMGLO App#
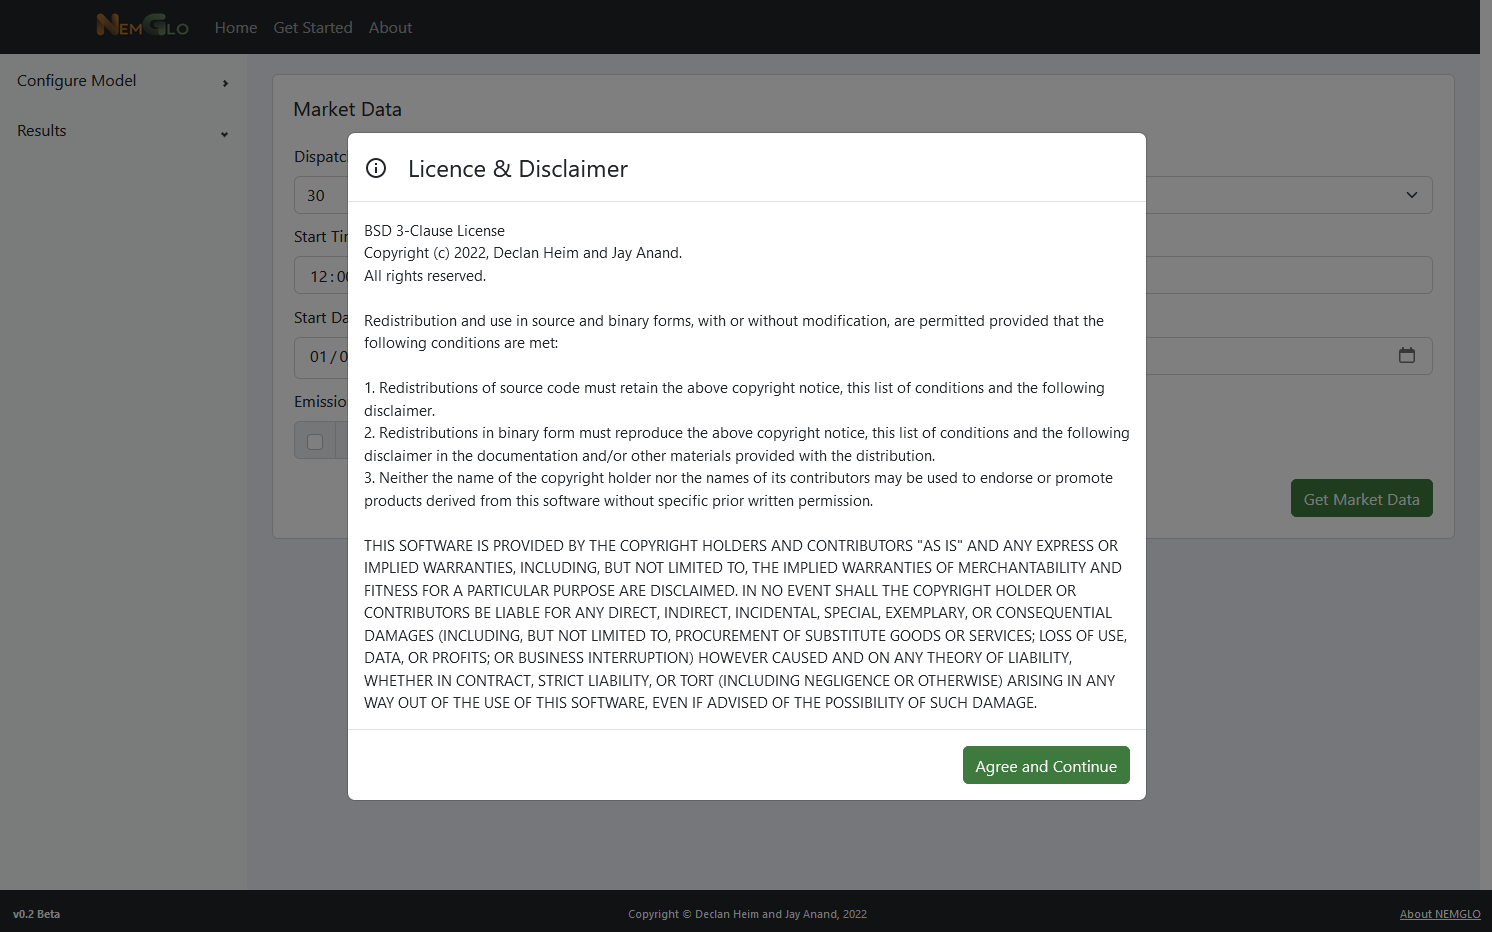
Once you have NEMGLO API installed locally, navigate to the website to start using the App: https://www.nemglo.org/simulator. A pop up will appear showing the tool Licence & Disclaimer. Please read and acknowledge by clicking the ‘Agree and Continue’ button.
The Simulation Process#
Using NEMGLO App is a fairly sequential process. This means you must complete steps in order before being able to move onto the next section, or access more features or results. An overview of the Simulation process includes:
Configuring Market Data. You must define the overarching parameters of your simulation. This includes a simulation daterange, market region, etc.
Once configured, you must load market data. This is intentional to provide you an overview of what is actually happening in the NEM historically at that time before you start to think about load operation :)
After step 2, if successful, a whole range of menu items become available underneath the ‘Configure Model’ option in the sidebar. These include settings you must define for the Electrolyser Load, Renewable PPAs and Operating Strategy objectives or constraints.
Once you are happy with the configuration settings for the model, you can progress to the ‘Simulate’ menu option in the sidebar. This is where you will commence the simulation as well as check the input parameters before doing so!
After you initiate a simulation from the ‘Simulate’ page, a loading graphic will appear. Upon completion the first results page should automatically appear. If it doesn’t, toggle the ‘Results’ tab in the sidebar menu and select one of the results pages.
From this point you can navigate between results charts, download data, or revisit any of the ‘Configure Model’ pages and change settings to again run new simulations.
That’s it! Hopefully this is relatively straight forward. If you come unstuck at any stage, an error message may appear as a popup on the screen with simulations logs. Check the documentation further for help, look for exisiting issues on Github or raise your own issues by posting your logs!
Continue reading to learn more about each page. The above may make more sense as you learn more about NEMGLO below.
App Layout#
Each page in the NEMGLO App has a similar layout, as listed:
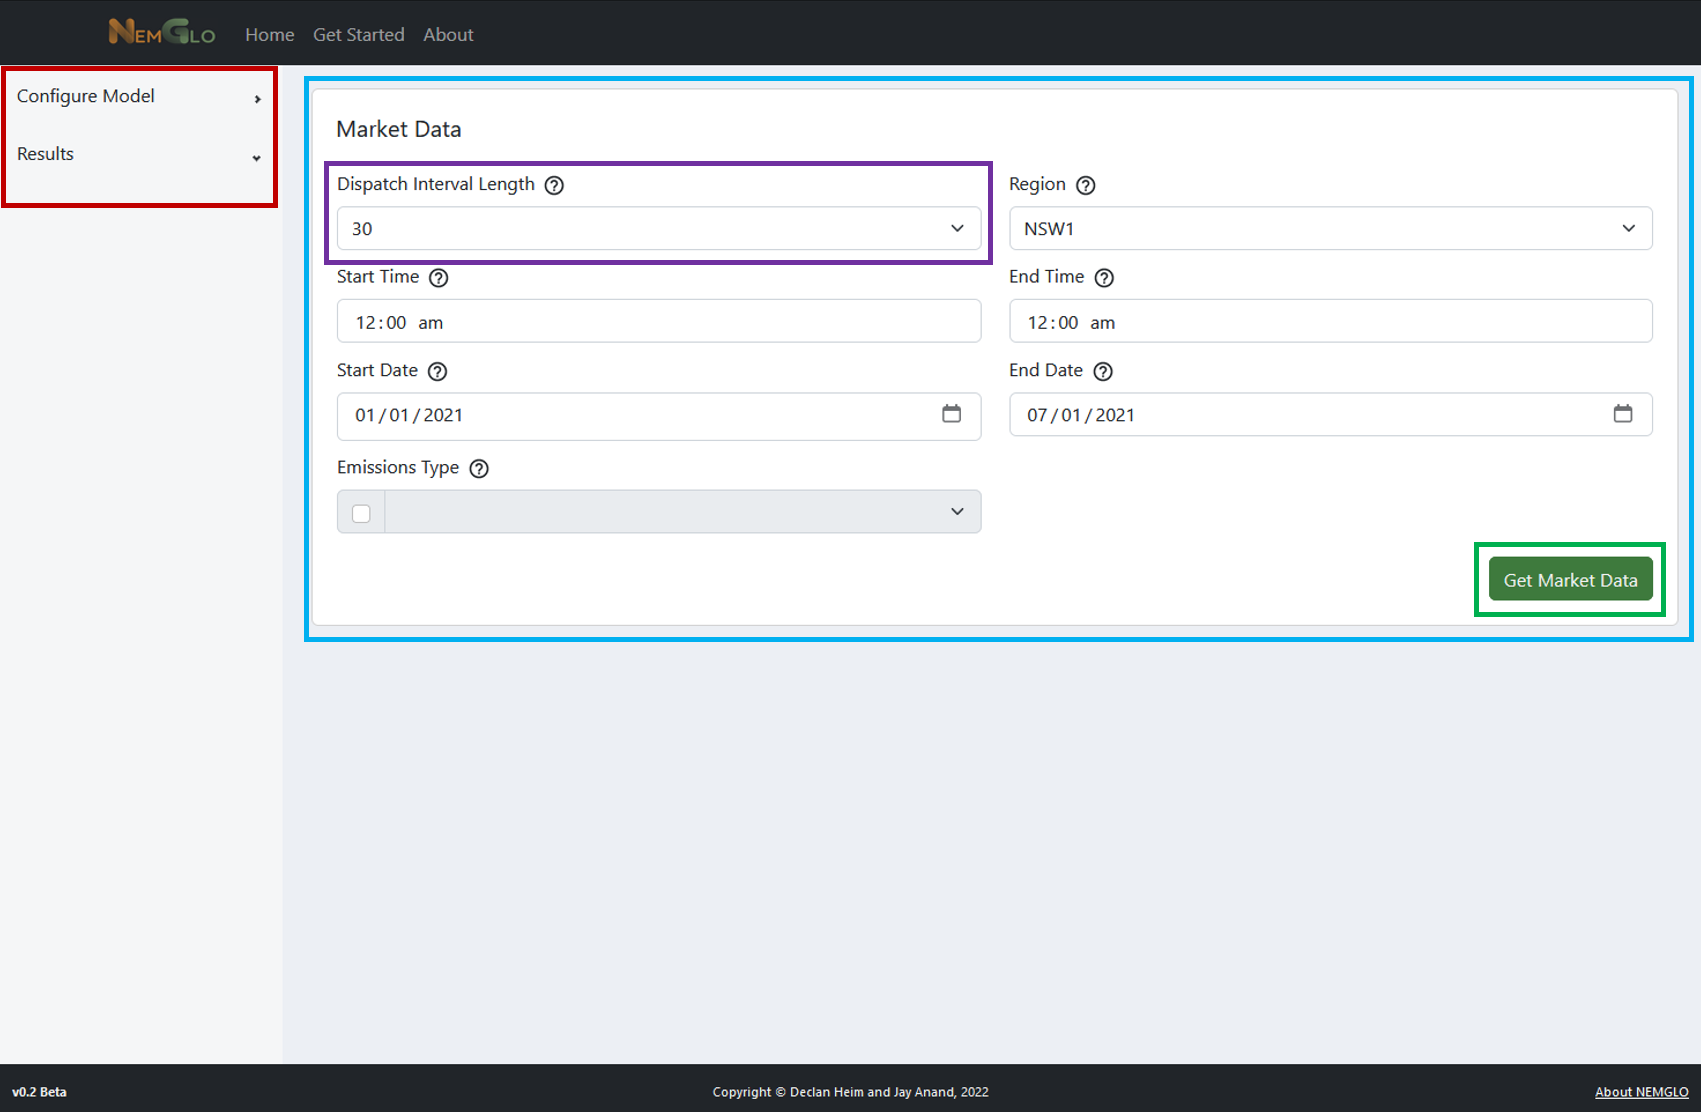
The red highlighted box below is the sidebar menu. The sidebar menu allows you to move between pages (when permitted, read further..) You may need to toggle a menu grouping (i.e. Configure Model) to expand the menu items that are contained inside each grouping. A down-facing arrow indicates the menu grouping is expanded. If nothing appears with a down arrow, it is likely that pages are hidden because you are not up to a certain stage in the simulation process.
The blue highlighted box is the page tile(s) or ‘card(s)’ This is where you will be able to configure inputs for the simulator and also view charts that will be produced when running NEMGLO. Some cards on subsequent pages can be toggled (enabled/disabled) depending on whether you want to include these inputs in your model. Any card with this feature will show a green button in the top-right corner of the card.
The purple highlighted box is an input field of NEMGLO App. These are generally dropdown menus, value (integer/float) input fields and sometimes can be toggled (enabled/disabled) by clicking a checkbox. A help icon will also usually be included next to the input field name. Hover over this icon for a quick description of the input option.
The green highlighted box (also the green button) is an action. In other words, this sends an API request to perform some calculations in NEMGLO itself and return some data. Clicking these buttons will either produce a new chart at the top of the screen, and/or enable more pages in the sidebar menu so you can proceed to the next steps in the simulation process.
Configure Model#
1. Market Data#
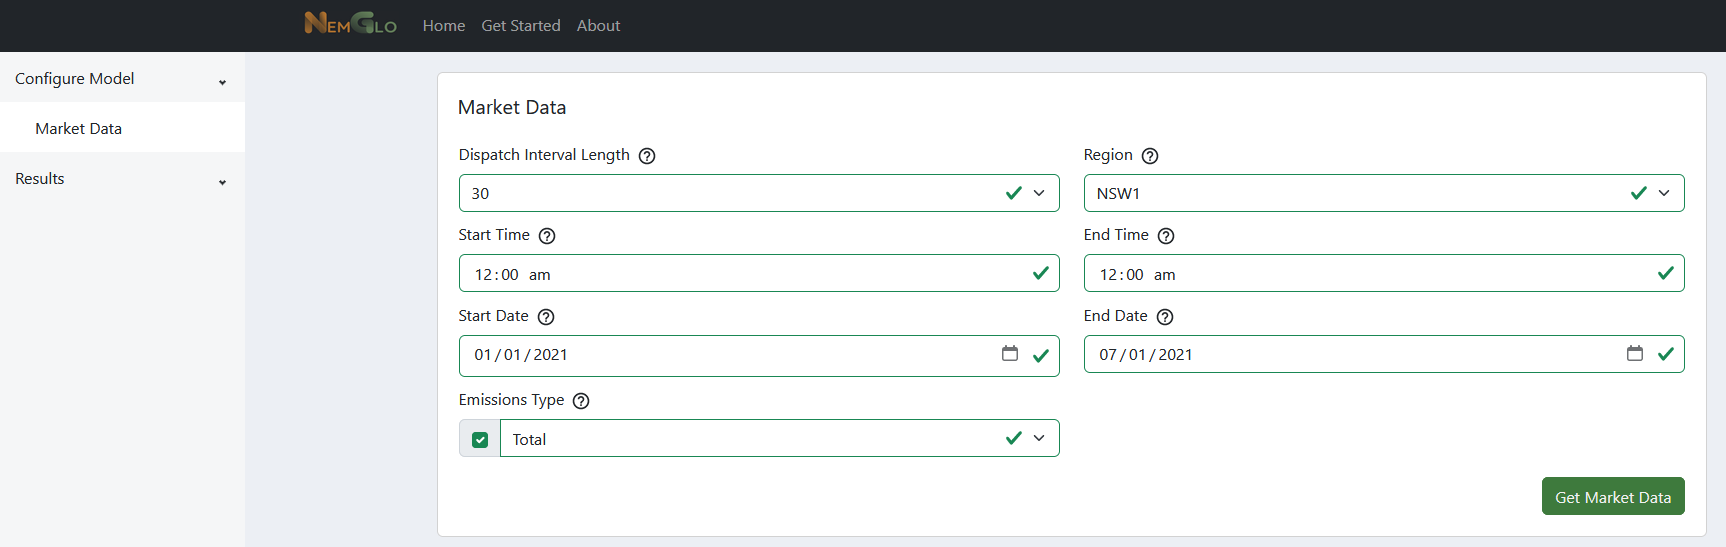
The Market Data page is where you can configure the simulation horizon (start and end datetimes), the dispatch interval length (simulation resolution), and whether to include emissions data.
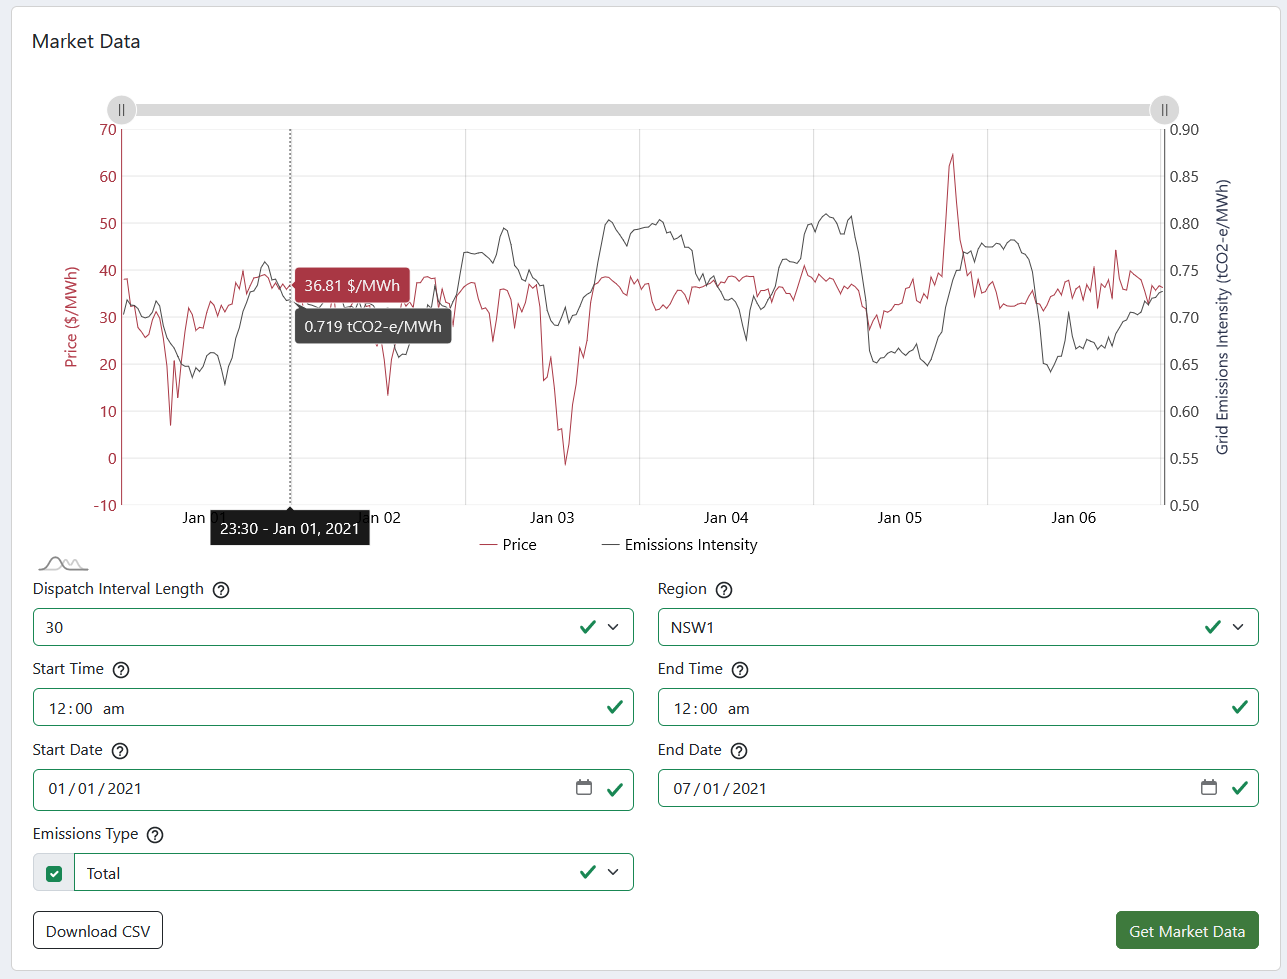
Depending on these settings, the time to process the input data and display the cost/emissions traces (as shown below) will vary. Enabling Emissions Type will take a little longer to load this market data.
A description of each input is listed below. Once you action Get Market Data, an interactive chart will appear at the top of the card allow you to view market cost/emissions traces. A Download CSV button will also show at the bottom-left of the card, allowing you to export the chart data.
Input Field |
Description |
|---|---|
Dispatch Interval Length |
Sets the time resolution of the simulated dispatch intervals. Can either be 5, 30 or 60 (minutes) |
Region |
Defines which NEM region data is retrieved and used as input traces to the model. |
Start Date/Time |
Defines the start of the simulation period. Note if the time is 12:00am, the first data point will be reported as 12:30am (i.e. datapoints are reported as Time Ending) |
End Date/Time |
Defines the end of the simulation period. If set as 12:00am, the last data point will be 12:00am. |
Emissions Type |
Emissions data can be enabled by ticking the checkbox to the left of the dropdown. When enabled, you can select a ‘Total’ (Weighted Average Emissions Intensity) or ‘Marginal’ emissions trace. In order to apply emission features later in the model, you must pre-load this data at this stage. |
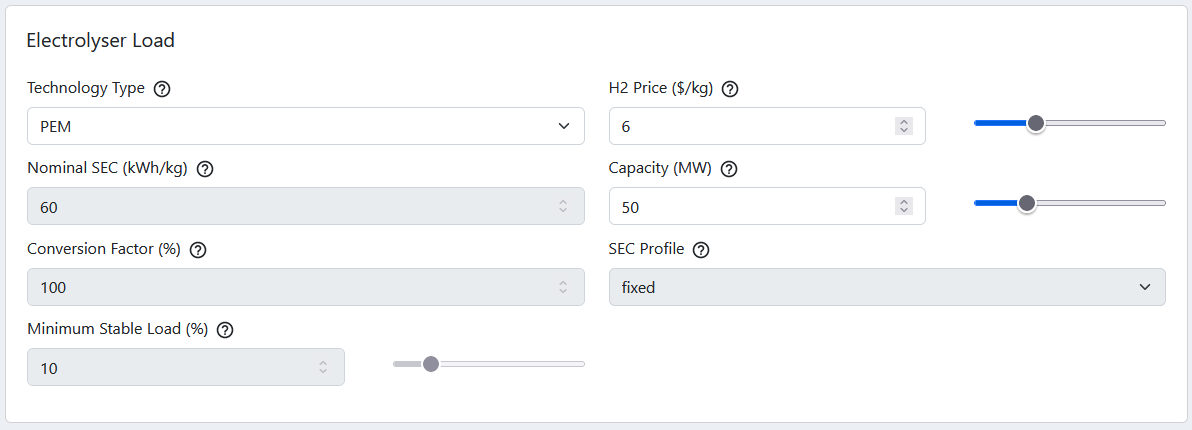
2. Electrolyser Load#
The Electrolyser Load page contains all the configuration inputs that characterise the load component in the model. The fields in the left side of the card are all linked to the Technology Type field, although each can be indepedently changed by setting this option to CUSTOM. The right fields are indepedently changed irrespective. Some references are provided here for the pre-filled options for PEM and AE. More details on the modelling methodology of NEMGLO can be found in relevant sections of the documentation, but a brief description is provided of the H2 Price in the Input Field table below.
Acronym Definitions:
PEM: Polymer Electrolyte Membrane -> a type of electrolysis (see resources below)
AE: Alkaline Electrolysis -> a type of electrolysis (see resources below)
SEC: Specific Energy Consumption -> A metric which indicates how much energy is required to produce hydrogen. In NEMGLO the unit for
SECis (kWh/kg).MSL: Minimum Stable Load -> (see input field table)
Cited Literature for hydrogen parameters:
Beerbühl et.al, 2015, https://doi.org/10.1016/j.ejor.2014.08.039
Kopp et.al, 2017, https://doi.org/10.1016/j.ijhydene.2016.12.145
Input Field |
Description |
|---|---|
Technology Type |
This can be set as |
Nominal SEC |
The (Nominal) Specific Energy Consumption of the Electrolyser Load defining how much energy (kWh) is required to produce one kg of hydrogen. |
Conversion Factor |
An efficiency consideration to apply to the Nominal SEC depending on whether the above metric is quoted for an electrolyser system or only the electrolyser stack. |
Minimum Stable Load |
The minimum stable operating point (defined here as a percentage of nominal load). If defined greater than zero, the load will always operate above the MSL or the load will be in an off-state (0 MW). |
H2 Price |
Using NEMGLO App, the objective function of the optimisation is written so as to minimize costs. Here the |
Capacity |
(Probably the most straight forward field on this page) Rated Capacity (also considered Nominal Load) of the Electrolyser in the context of electricity (in other words, how you characterise any generic electric load). |
SEC Profile |
NOT IN USE. If interested, explore the NEMGLO python library |
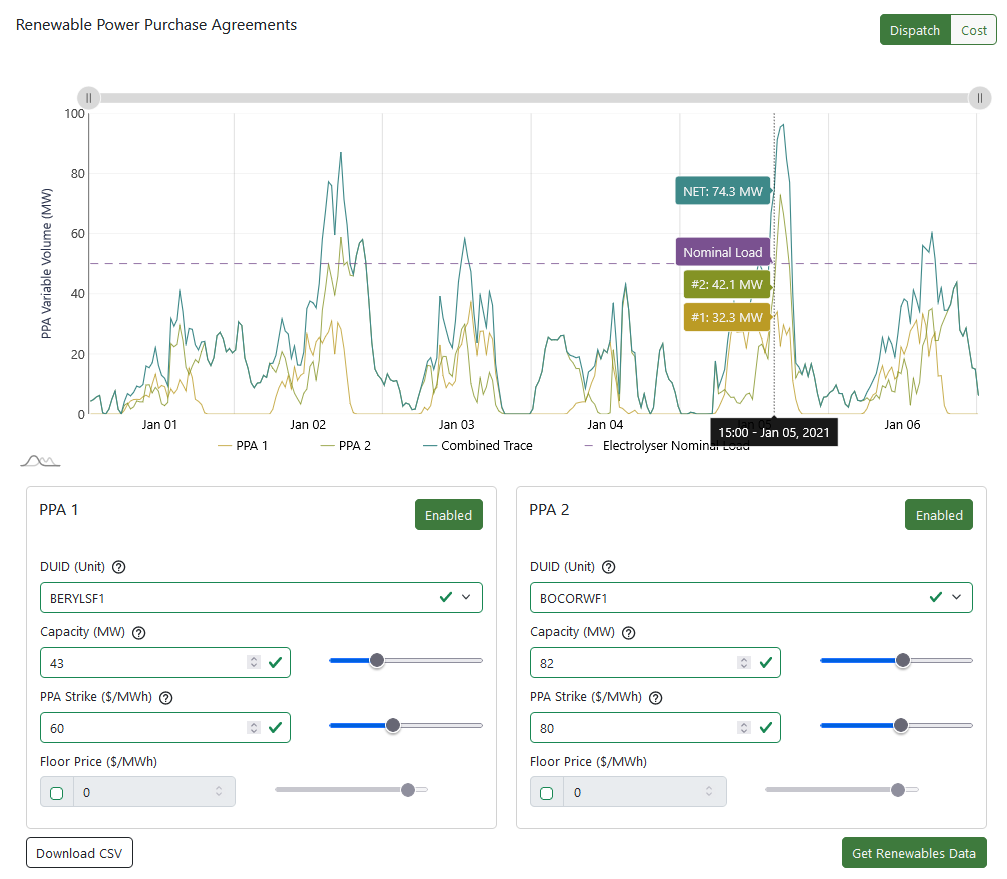
3. Renewable PPAs#
The Renewable PPAs page (one of my favourites :D ) allows you to preload renewable traces from historical NEM dispatch data by DUID, then scale these traces as you wish by a defined Capacity (MW). Noting these traces are used in the model as hypothetical plants, not reflecting the plant’s actual capacity or MW generation per say (unless of course you choose to set it as such). The PPA strike price is of course an important input in determining the load’s profitability and how it may adjust operation to match to renewable (green) energy. Optionally, a floor price can be enabled as configured for the PPA as well.
Either PPA 1 and/or PPA 2 can be enabled, or both disabled if you do not wish to include PPAs in your model, simply by toggling the green buttons in the top-right of each card. Clicking Get Renewables Data will generate the charts as shown below, with a Combined NET trace when both PPAs are enabled, as well as the nominal capacity of the load to visually assist you in either under-/over-sizing the PPAs as desired. By clicking on the green button in the very top-right of this page, Cost, the chart will show the calculated costs temporally for each PPA based on the preload historical price trace from the Market Data page and the strike/floor prices as defined.
Once more a Download CSV feature is provided in the bottom left of the page.
Tip
If load the renewables data then make changes to the fields in each PPA card. The charts should immediately update to reflect those parameter changes. You do not need to reload with Get Renewables Data. Everywhere else in NEMGLO you should always refresh! Note if you change a DUID though, you must refresh the chart using Get Renewables Data.
Warning
Some DUIDs may not have any data available for the date range you set on the Market Data page. Either they may not exist then, or be commissioning, outage, etc. This is why it is important to always check the charts on this page before running the optimisation on the simulate page.
Input Field |
Description |
|---|---|
DUID (Unit) |
The historical (capacity factor) trace that you wish to apply to the model. The available list of DUIDs reflects only solar and wind generators in the region you selected on the |
Capacity |
The desired capacity you wish to set for the renewable plant. The loaded capacity factor trace is scaled by this value. This value can also be interpreted as the contract volume of the PPA. |
PPA Strike |
The strike price of the PPA contract. |
Floor Price |
If enabled, this defines a floor price for the PPA contract. The PPA cost incurred to the load is considered as the strike price minus max(floor price, spot price). |
4. Operating Strategy#
The Operating Strategy page has more advance configuration features for the model. This page can be a bit fiddly as well, since many of these settings are dependent on prior configurations. For example, you won’t be able to enable Emissions in the model unless you preload the Emissions Trace on the Market Data page. Similarly the model cannot sell excess RECs if you don’t have them to begin with, or it doesn’t know what price to sell them at!
Hovering over help icons and elements should assist you to work out what’s going on here. More documentation will be added with time.
Warning
There are known (and unknown) bugs with these configurations. If your simulation breaks, please let us know by raising a Github Issue so we can fix them. You can try disabling the card, and the model should work without these configurations. You can also refresh your browser window to reset everything and start over.
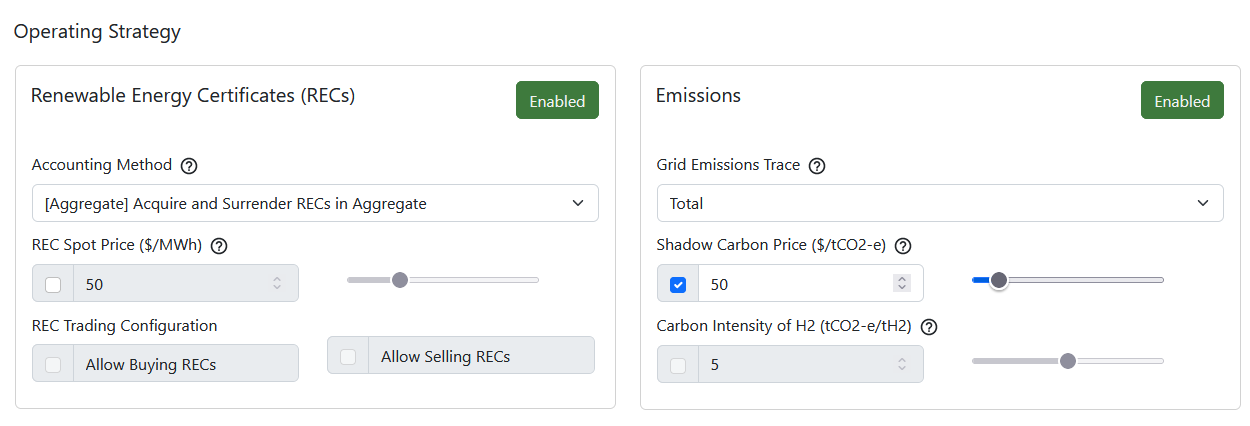
Renewable Energy Certificates#
Input Field |
Description |
|---|---|
Accounting Method |
If set as |
REC Spot Price |
This determines a market price at which RECs acquired through the PPA may be onsold, or at which surplus RECs may be bought in order to meet the balance calculation described above. This price has nothing to do with PPA configurations! Rather it is intended to reflect a certificate pool price (such as the LGC registry), although it is static and doesn’t change over the simulation horizon. |
REC Trading Configuration |
Enabling these options will correspondingly add buy and sell terms to the balancing calculation described above. |
Emissions#
Note, a shadow carbon price and carbon intensity constraint are mutually exclusive.
Input Field |
Description |
|---|---|
Grid Emissions Trace |
This setting should reflect the trace selected on the |
Shadow Carbon Price |
If enabled, a cost is applied in the optimiser’s objective function assosciated to the carbon intensity of acquiring excess energy from the spot market (in excess of the contracted PPA variable volume) at every dispatch interval. |
Carbon Intensity of H2 |
If enabled, the optimiser will consider the carbon intensity of any surplus energy acquired from the spot market (in excess of the contracted PPA variable volume) and limit the amount of excess energy to the threshold that is calculated here based on the total produced volume of hydrogen. |
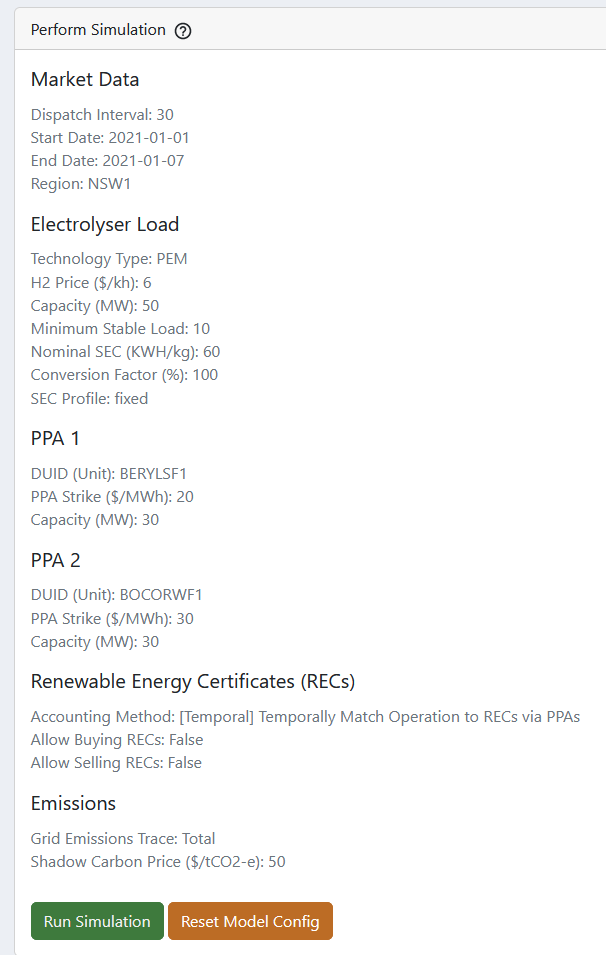
Simulate#
This page is fairly self-explanatory and provides a review of all parameters set prior. Cards (and individual input fields) which have been disabled will likely not appear, or be defined as false for example. When you are ready to run the optimiser (via the NEMGLO API) click Run Simulation. The Reset Model Config will do as written and take you back to the beginning (equivalent to refreshing your browser page).
Results#
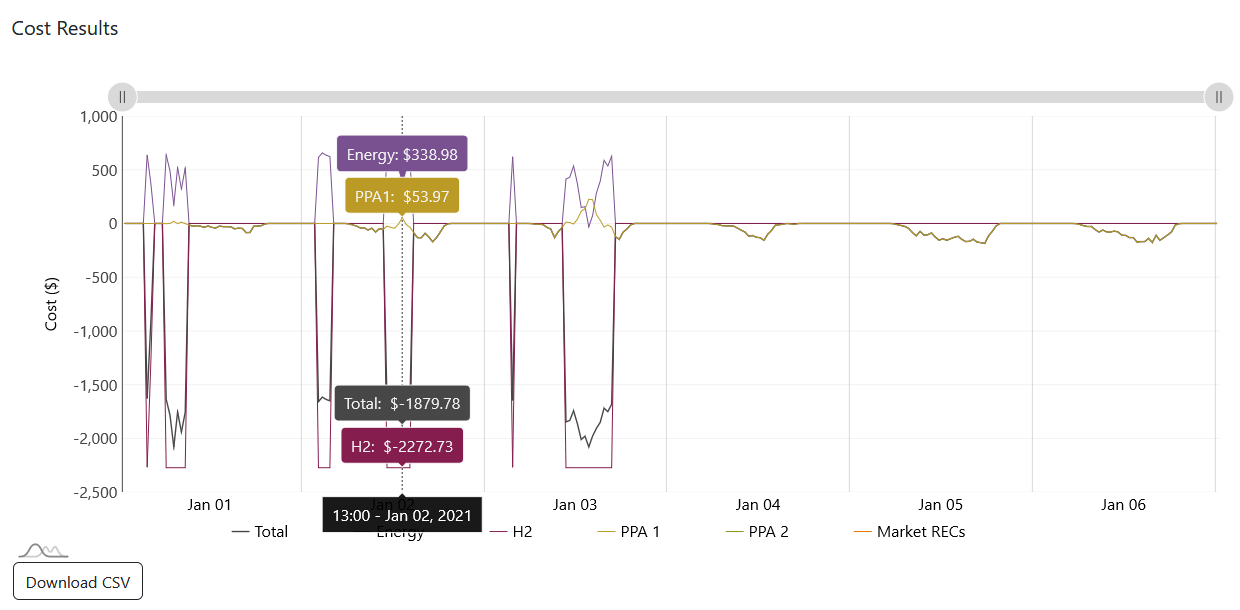
Results will be shown on two pages Price & Dispatch and Costs once the optimiser is complete. Each page has an interactive chart and Download CSV option. An example of each is provided below. In this scenario, you can visually observe that the load operation is confined by the amount of certificates acquired from the solar PPA which is undersized. However, there is no temporal matching between the renewable energy generated and the load’s operation.
Tip
These charts can get busy quickly! Click on the series name in the legend to temporarily hide or re-show a specific series. Also scroll when your mouse is located over the chart to zoom in, or use the movable axis bar at the top of the chart.
Price & Dispatch#

Costs#
Common Problems#
Does your screen look like this? If no chart appears on the Market Data page after clicking Get Market Data, that is because no data was returned. You also won’t see any other menu options in the sidebar :( This is most probably because there is no API running in the background on your machine. Make sure you have the NEMGLO API running first, before trying to request data. Refer to the Get Started Webpage for instructions.